
TokenPost.ai
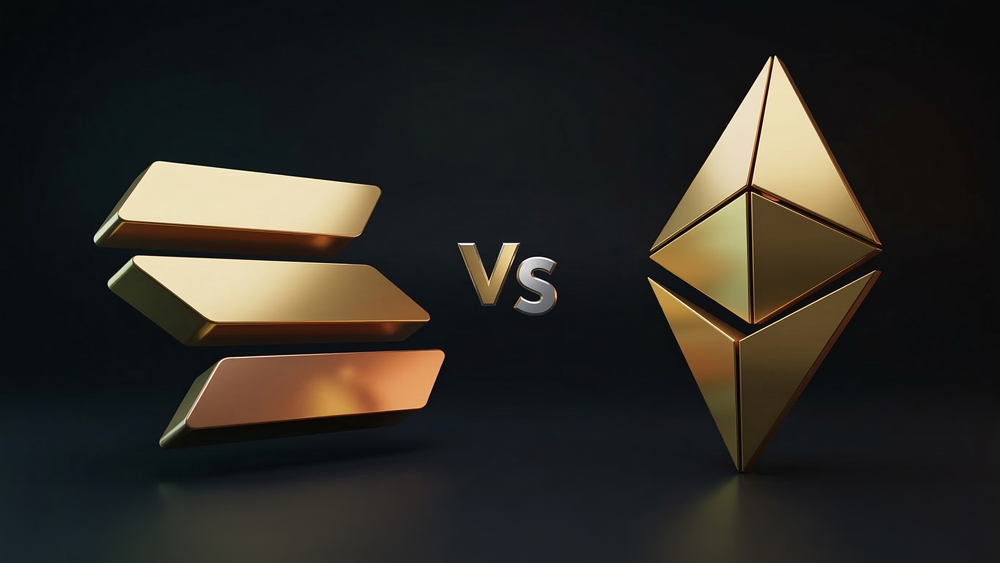
Ethereum (ETH) and Solana (SOL) are increasingly being compared through a single, headline-friendly metric: fees. But the latest data suggests the rivalry has moved beyond ��who earned more�� and into a more consequential question��where value is being created, and who ultimately captures it.
As of April 2, 2026 UTC, Ethereum generated $4.75 million in 24-hour fees, down 2.94% from the prior day, while Solana posted $6.67 million, up 24.87% over the same period. On a daily snapshot, Solana is clearly ahead. Over longer windows, however, Ethereum remains in front: $317.49 million in fees over 30 days versus Solana��s $186.02 million, preserving roughly a 1.7x gap. The divergence points less to a simple demand difference than to a structural split in how each network monetizes activity.
Ethereum��s shift: fee revenue is being ��externalized�� into a broader stack
The most important change in Ethereum��s fee dynamics has accelerated since the Dencun upgrade, which reinforced Ethereum��s migration toward a Layer 2-centric economy. Network usage metrics remain elevated��daily active addresses are reported around 2 million, with smart contract calls near 40 million��yet base-layer fees have not risen in tandem. The implication is not that revenue ��disappeared,�� but that it has been redistributed across a wider economic perimeter.
In practical terms, value capture is increasingly fragmented across three layers:
- Base layer (L1): positioned for higher-value settlement such as bridging, large DeFi flows, and institutional transactions.
- Layer 2s: optimized for high-volume, low-cost execution, where revenues concentrate in sequencers rather than on L1 gas.
- MEV supply chain: block-building and transaction ordering that can monetize activity in ways that do not always show up as simple ��fees.��
This has created what some analysts describe as Ethereum��s ��invisible revenue�� expansion: economic activity that is real and monetizable, but not fully reflected by L1 fee totals alone. The growth of stablecoin settlement and real-world asset tokenization has been central to this narrative. With stablecoin liquidity estimated at $1.62 trillion and tokenized Treasury-style instruments and corporate cash management increasingly moving on-chain, Ethereum��s role looks less like a consumer app platform and more like a financial settlement backbone��where per-transaction charges can be low even as the underlying value being settled grows sharply.
Solana��s model: speed-first, on-chain monetization with direct attribution
Solana, by contrast, keeps activity and monetization largely on its L1. Transactions are processed directly on the base chain, and fees flow to validators in a more transparent, easily measured loop. The latest 24-hour fee surge is widely interpreted as a response to short-term trading intensity��often linked to heightened activity in derivatives, memecoins, and high-frequency DeFi strategies that benefit from Solana��s throughput and latency profile.
Recent aggregates illustrate the split:
- 24-hour fees: Ethereum $4.75M (-2.94%) vs. Solana $6.67M (+24.87%)
- 7-day fees: Ethereum $55.07M vs. Solana $35.93M
- 30-day fees: Ethereum $317.49M vs. Solana $186.02M
From an economic lens, Solana is optimized for high ��velocity�� revenue��capturing monetization from rapid, frequent transactions��while Ethereum increasingly captures higher ��margin�� settlement flows across a layered ecosystem.
The capital-flow variable: stablecoin issuers and tokenized assets
One of the most closely watched drivers this quarter has been Circle (CRCL) and the broader expansion of stablecoin-based payments and tokenized real-world assets. Market participants argue that the infrastructure built around USDC settlement and tokenized government debt has strengthened Ethereum��s case as a de facto ��global settlement layer.��
Critically, that shift does not necessarily translate into higher headline fee totals. Instead, it can produce second-order effects: larger gross settlement volumes despite lower unit fees, increased bridge and institutional routing activity, and higher MEV and settlement-related monetization��while execution migrates to Layer 2s where fees accrue elsewhere. In this framework, declining or stagnant L1 fees do not automatically imply declining network relevance; they can also signal that larger pools of capital are moving more efficiently through the stack.
Flash spike or structural rotation?
The short-term picture favors Solana, with a clear daily revenue lead. But the 7-day and 30-day totals still point to Ethereum��s persistence as the dominant fee generator in aggregate terms��and, more importantly, to its growing role in longer-duration capital settlement. The roughly $131 million 30-day gap is being read by some analysts as evidence that institutional-style flows are still concentrating more heavily around Ethereum��s ecosystem, even as execution-heavy segments of crypto trading periodically surge on Solana.
Ultimately, the fee race has become harder to adjudicate with a single scoreboard. Solana is positioning itself as the winner in ��speed�� and high-frequency monetization, while Ethereum is building a case as the winner in ��value settlement�� across a modular stack. The key question for the market is no longer just who earns more fees on a given day, but who is moving��and retaining��larger pools of capital over time.